Data Visualization & Infographics
A People's Guide to New York City
Antipsychotics in U.S. Nursing Homes
Calendar of Killings by Police
Conflict Dynamics around Refugee Settlements in Northern Uganda
Data Visualization and Human Rights
Executions and disappearances in Punjab
Gold Trade in the Democratic Republic of Congo
Human Rights Watch World Report 2005
Journalists Imprisoned in China
Kardze Tibetan Autonomous Prefecture
Nigeria School Attacks Timeline
Policing Poverty and Racial Inequality in Tulsa
Selected CIA Aircraft Routes and Rendition Flights 2001-2006
Stephens, Catherwood, and Katz
Timeline of Boko Haram Abductions
Visualizing Data for Human Rights Advocacy
Visualizing Information for Advocacy: An Introduction to Information Design
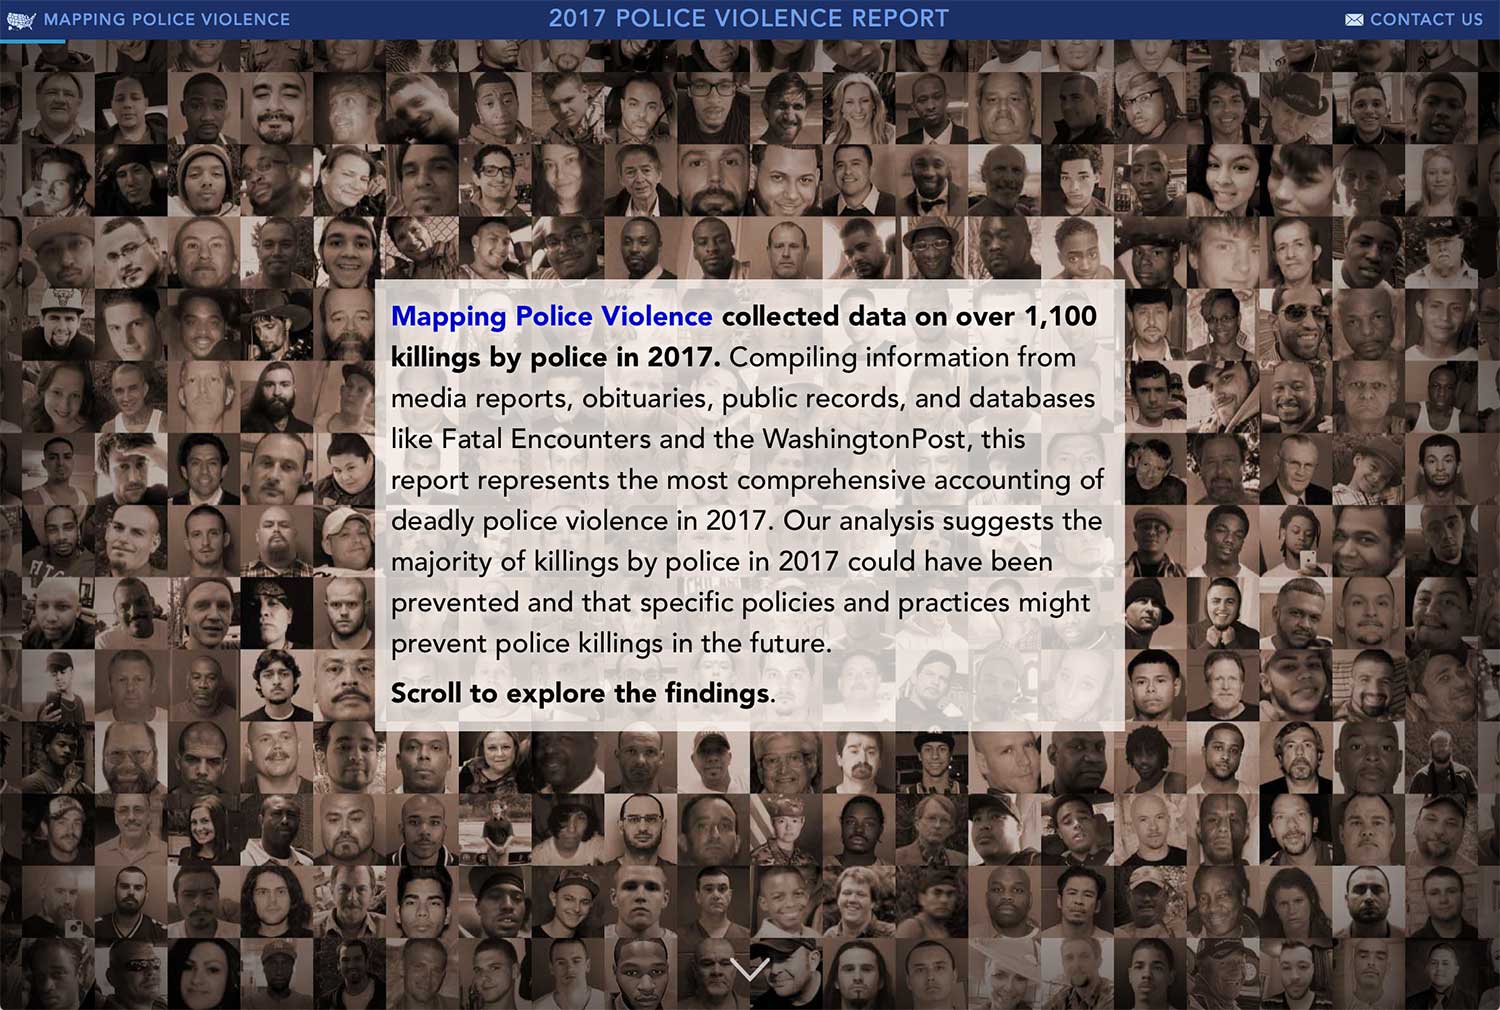
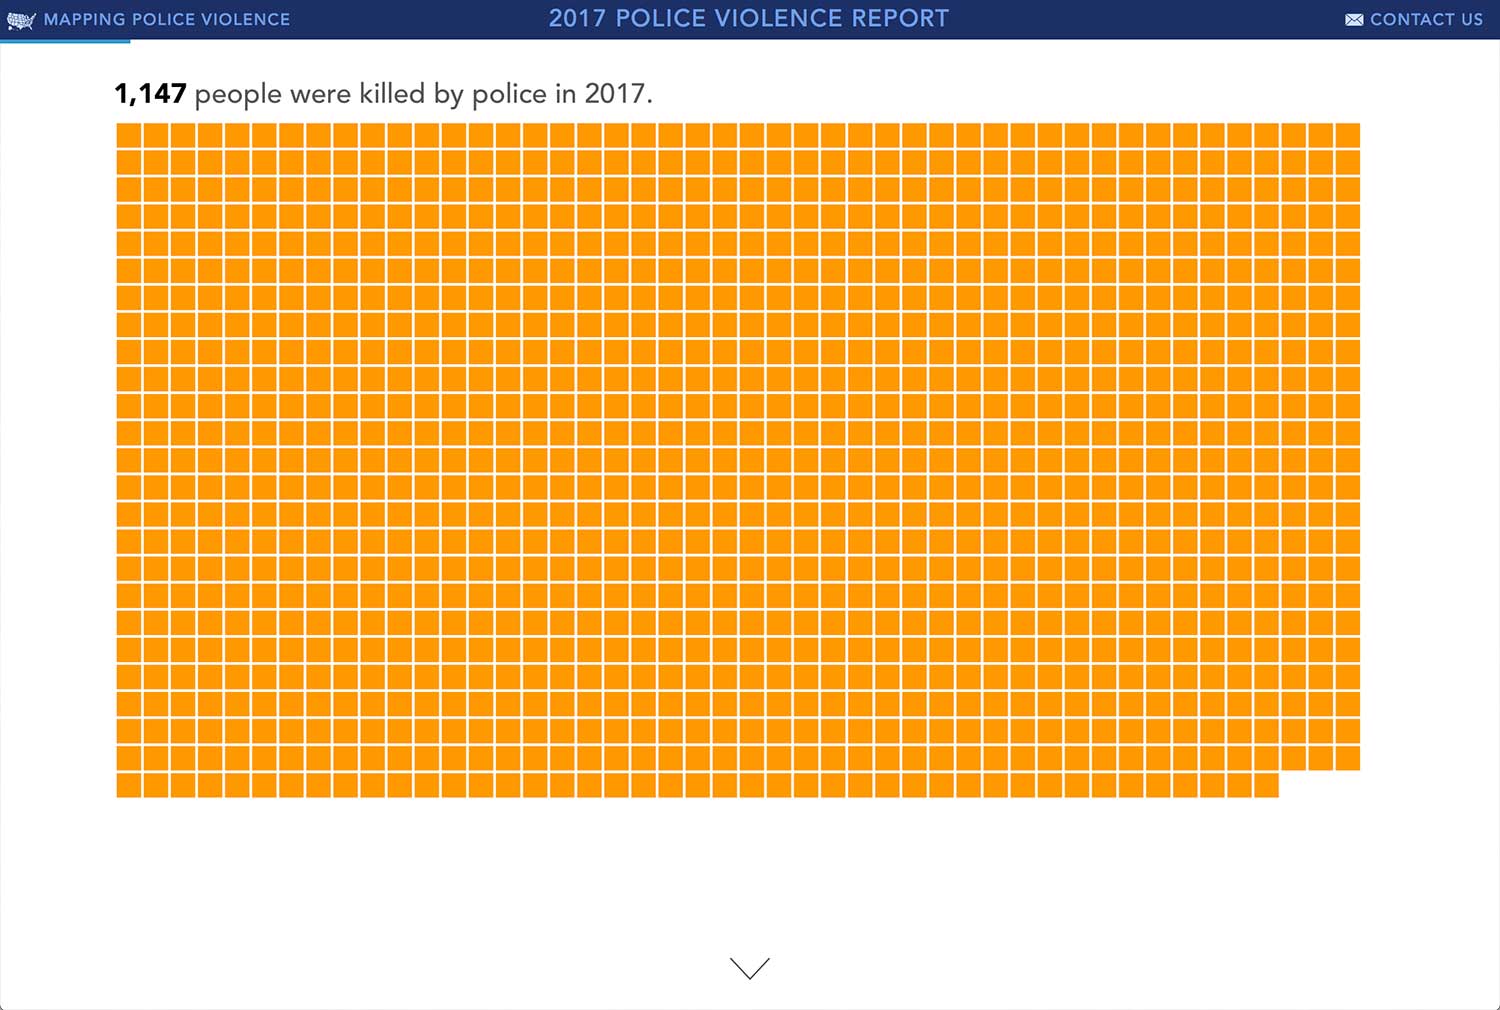
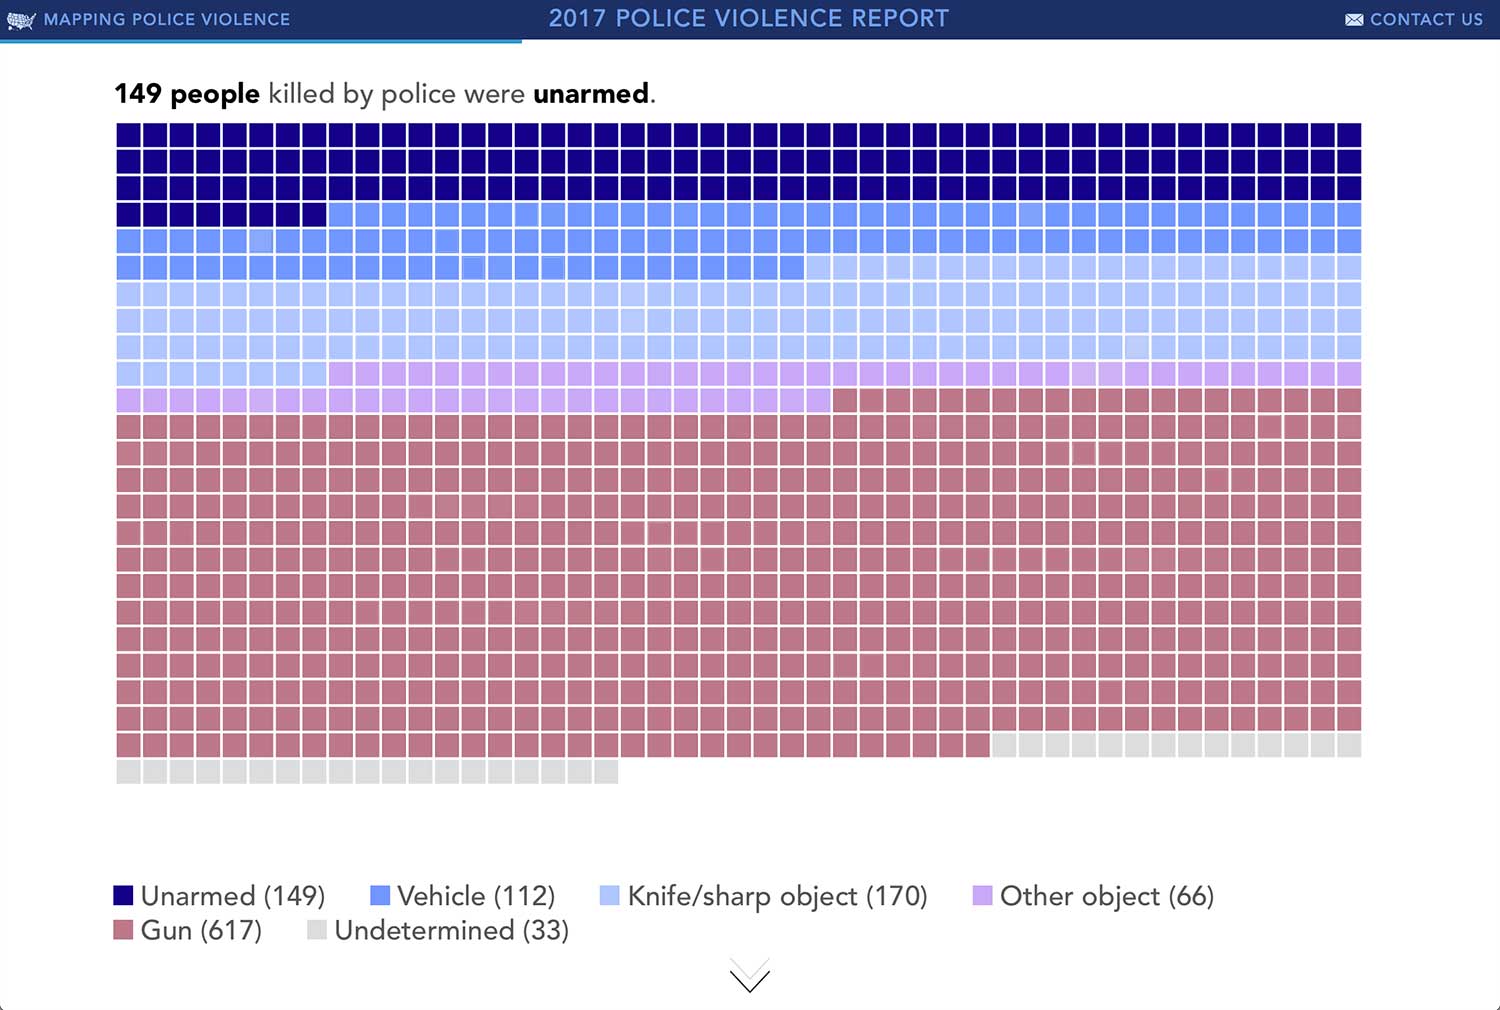
Police Violence Report
The Police Violence Report is an animated, visual analysis of 1,147 people killed by police in 2017. The project used data collected by Mapping Police Violence and analysis by Sam Singyangwe and the team at We, The Protestors.
In January 2021, it was updated with analysis of the 1,127 people killed by police in 2020.