
information design
Design Power
Hacking on a workshop plan and thoroughly appreciating Power - A Practical Guide for Facilitating Social Change:
“Power can be the ability to act visibly in ways that affect others, but it is also the power to act behind closed doors through more hidden and invisible means. Power can be about what is on the agenda, but also what is kept off; about who speaks, but also who does not; about whose voices count, as well as whose voices go unheard. As such, power is about what we see easily and experience directly, as well as what we do not see. For this reason, we need deliberate and creative ways to understand it and to make how power affects our everyday lives more legible and visible to ourselves and to others.”
And from Making Change Happen: Power (PDF):
“In reality, power is dynamic, relational and multidimensional, changing according to context, circumstance and interest. Its expressions and forms can range from domination and resistance to collaboration and transformation. This is good news for social justice promoters whose strategies depend upon new opportunities and openings in the practice and structures of power.”
Information design can be a useful tool to visualize and understand sources of power — and as a result facilitate the mobilization of power.
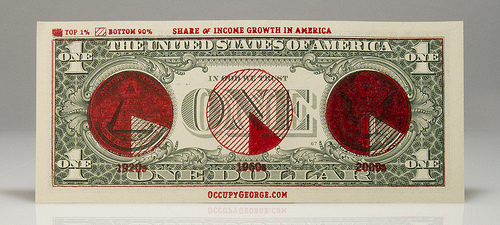
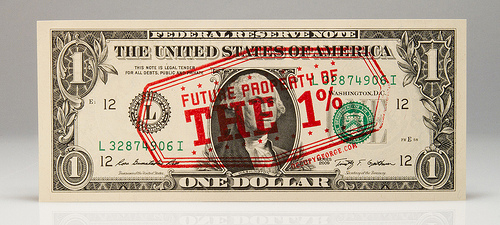
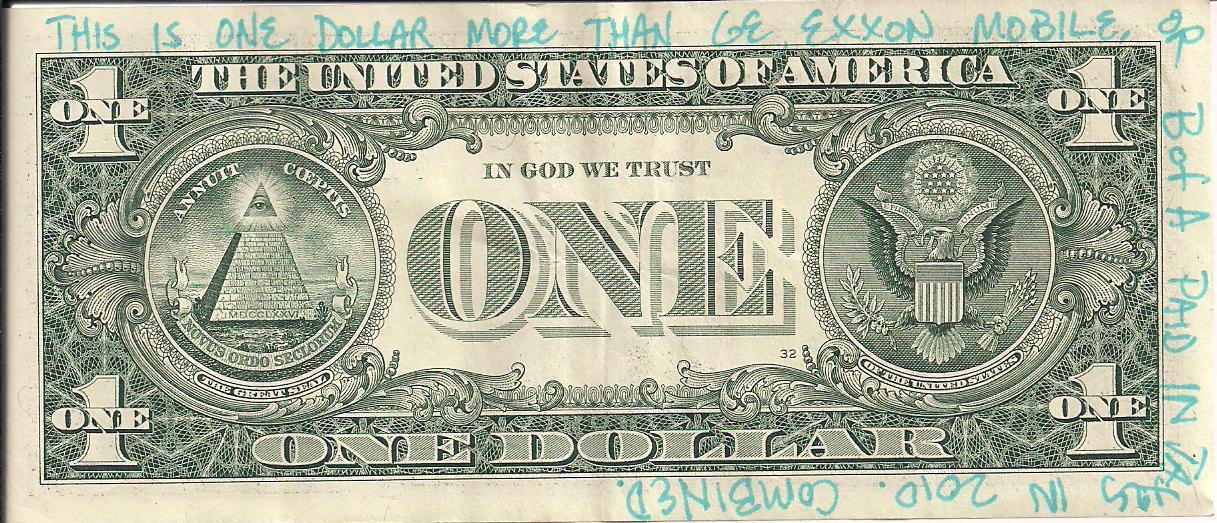
Follow the Money
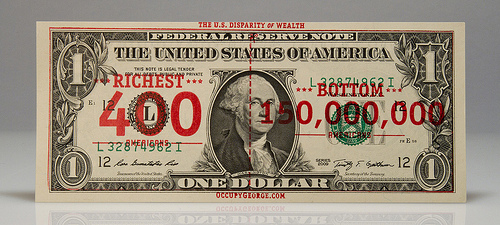
The tents have been cleared from the park, but the currency of ideas still circulate. Occupy George is a lovely Occupy Wall Street intervention that visually describes disparities in U.S. wealth on a bit of the wealth itself. It’s infographics in your pocket!
Political Graffiti
All graffiti have their politics but some more explicitly call for public policy change. Here are a few interesting pieces I’ve run into in the last week. An effective mix of surprise and cheek.
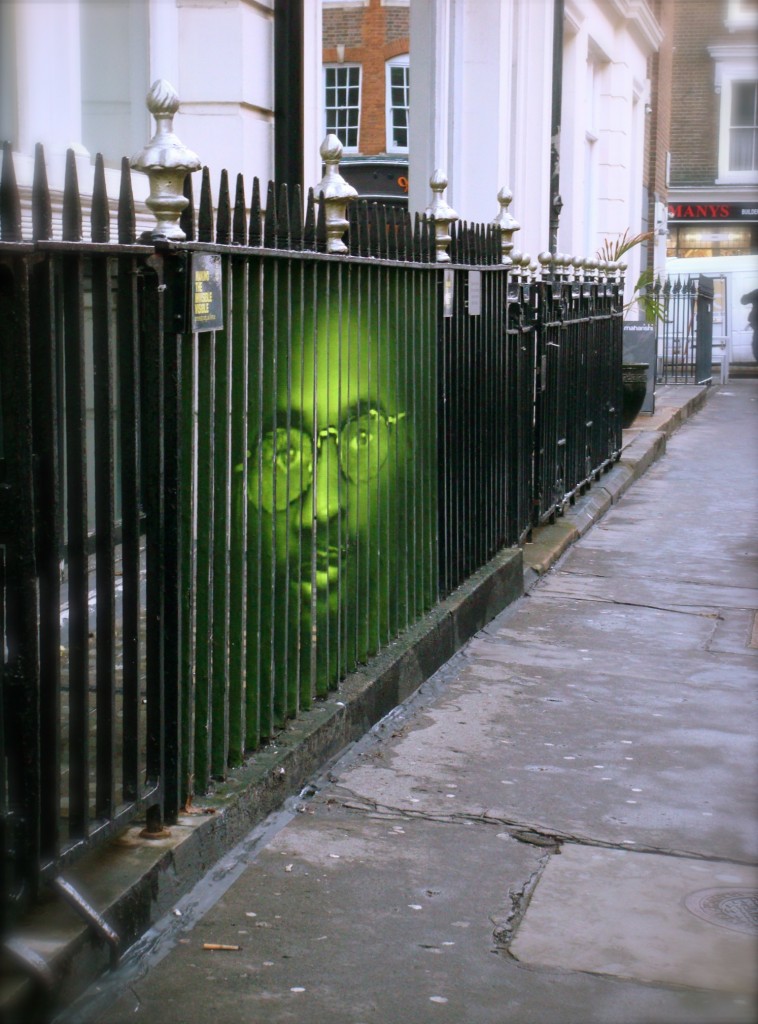
A portrait of Troy Davis wheatpasted to the sides of a fence in London for Amnesty International UK, protesting his then pending execution in Georgia. More »

Residents, environmentalists and officials want to tear down an obsolete dam near Ojai. After years of protest, a band of artists used creative tactics to call attention to the issue. The image appeared on the front page of the local paper the same day environmentalists, county officials, and the Army Corps of Engineers met to discuss the dam. More »
A nice bit of information design. (Via)
 “The Iconathon is an initiative to collaboratively design new civic symbols for the public domain.… In August & September 2011, several cities across the US will participate in a series of design charrettes — day-long collaborative workshops — called ‘Iconathons’. Through facilitated design sessions, event participants will generate icons and symbols that visually convey concepts frequently needed in civic design.”
The events are co-organized by The Noun Project which hosts a large number of public domain and creative-commons license icons you can download.
Stuxnet: Anatomy of a Computer Virus
Stylish and powerful infographic on the nature and ramifications of the computer virus Stuxnet.
While not the first time that crackers have targeted industrial systems, Stuxnet is the first discovered malware that spies on and subverts specific industrial systems and is widely suspected of targeting the uranium enrichment infrastructure in Iran.
Patrick Clair designed and directed the animation for the Australian television program Hungry Beast.
This may be old news (Stuxnet was discovered a year ago,) but the consequences are still playing out.
ICC Indictments
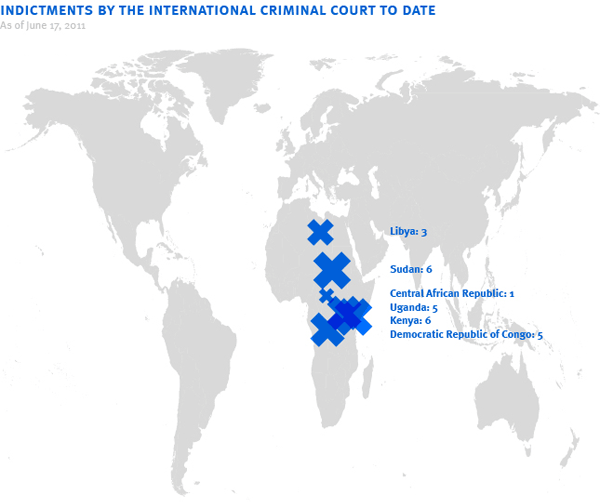
Since its founding in 2003, the International Criminal Court has issued 26 indictments. Not saying the charges aren’t warranted, but there seems to be a geographic pattern here. See also.
The High Line, Part 2

The second section of The High Line opened to the public today. Once slated for demolition, the depression-era elevated railway has been converted into a unique public park running along the west side of Manhattan. The new section extends the Line another ten blocks — nearly doubling the park’s previous length. I’ve written about the Line, the amazing grassroots campaign behind its rescue and redevelopment, and their strategic use of graphics. And though I use these graphics below in presentations about campaign communication, I’ve never posted them here.
These infographics were produced by James Corner Field Operations and used in community meetings early in the redevelopment process. The images are more impressionistic than quantitative, but they really capture a sense of the vibrant growth, use, flora and fauna projected over the first 5 years of the Line. What New Yorker wouldn’t want to be right in the middle of that cluster of flowers and birds (especially if they didn’t have to leave Manhattan?)
For the full effect, click below for higher resolution versions.
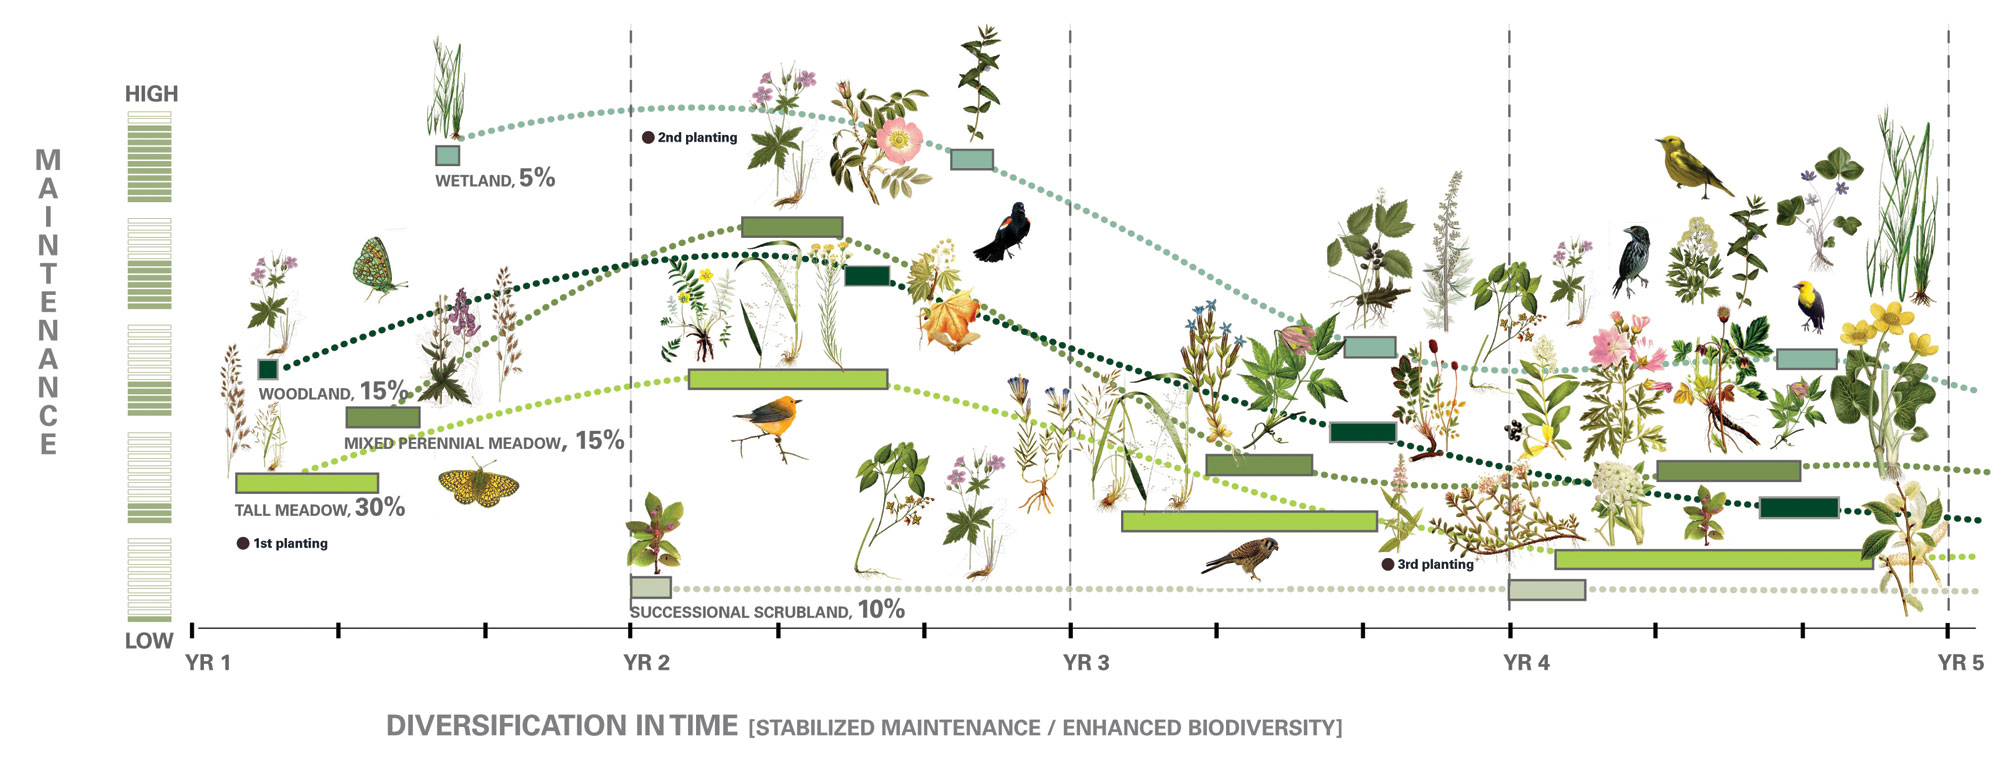
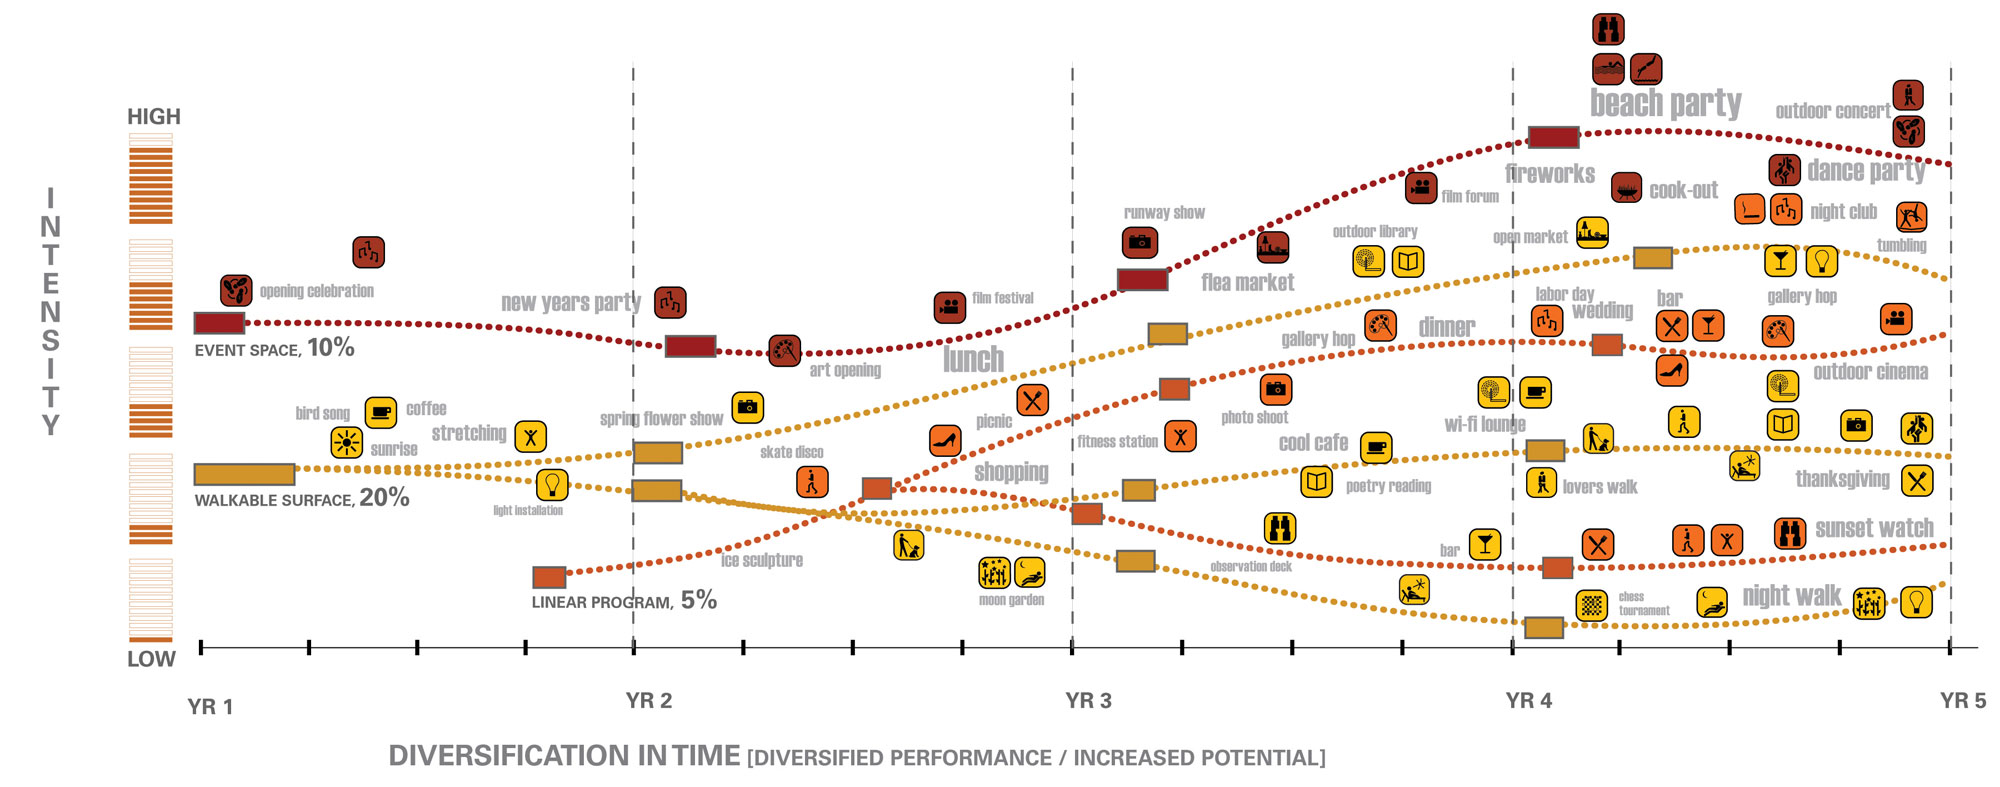
What these graphics don’t capture is the incredible economic impact of the the Line. Gentrification in the Meatpacking District was underway well before redevelopment of the Line began, but the transformation of the far west side has astonished many. But then that was perhaps a different presentation — one of the first tactical moves of the campaign to save the Line was an economic redevelopment and feasibility study. That certainly has paid off.
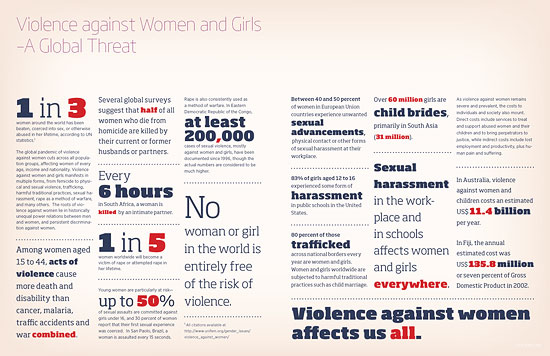
Violence Against Women
This spread was cut from a recent project of mine — the client revised the text to incorporate the data throughout the book — but I thought it was urgent so am posting it here. Click below to download a PDF version. Feel free to use it.