Data Visualization & Infographics
A People's Guide to New York City
Antipsychotics in U.S. Nursing Homes
Calendar of Killings by Police
Conflict Dynamics around Refugee Settlements in Northern Uganda
Data Visualization and Human Rights
Executions and disappearances in Punjab
Gold Trade in the Democratic Republic of Congo
Human Rights Watch World Report 2005
Journalists Imprisoned in China
Kardze Tibetan Autonomous Prefecture
Nigeria School Attacks Timeline
Policing Poverty and Racial Inequality in Tulsa
Selected CIA Aircraft Routes and Rendition Flights 2001-2006
Stephens, Catherwood, and Katz
Timeline of Boko Haram Abductions
Visualizing Data for Human Rights Advocacy
Visualizing Information for Advocacy: An Introduction to Information Design
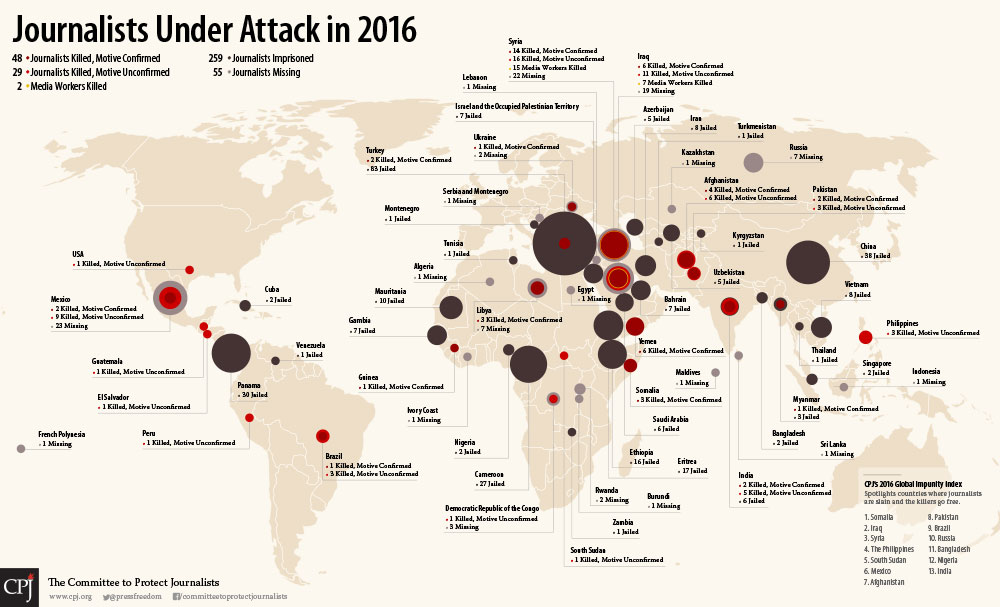
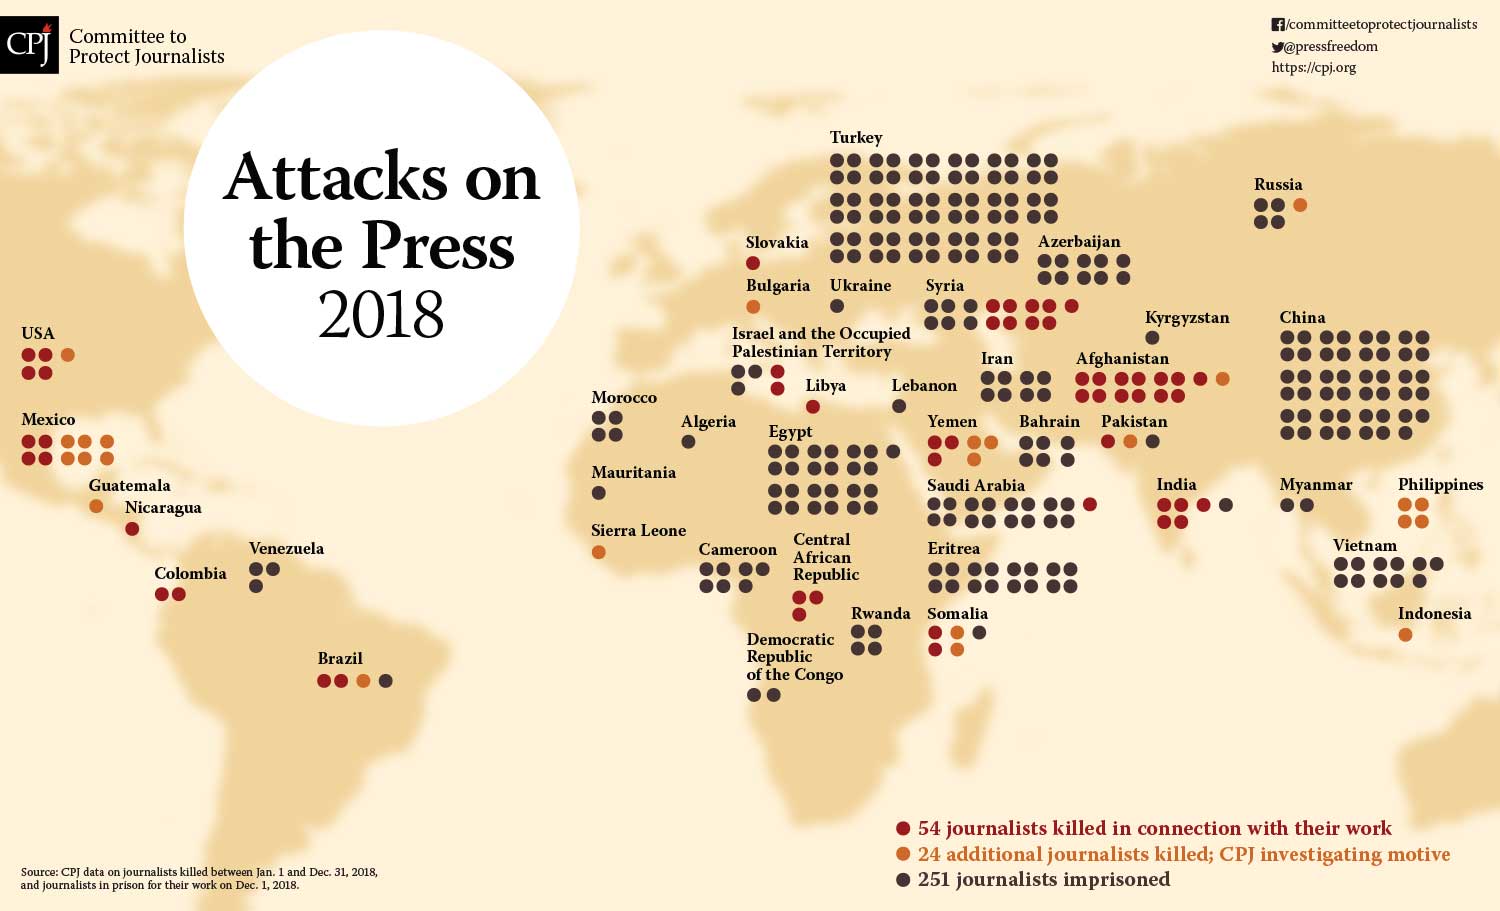
Journalists Under Attack
Designed for the Committee to Protect Journalists, this poster visualizes the number of journalists killed, missing, and imprisoned in 2016. The poster was reworked two years later to use the 2018 data.