

March 2004
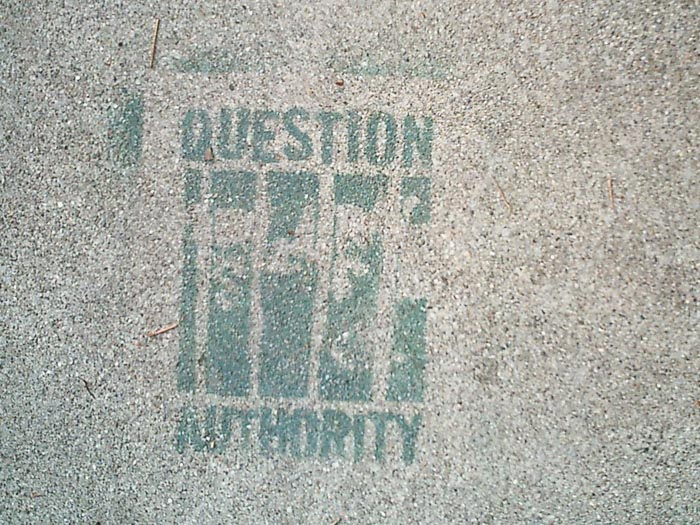
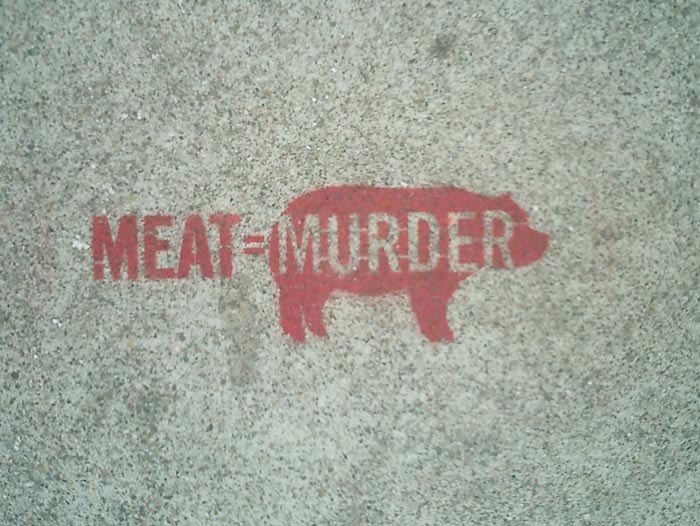
Stencil Graf, San Francisco
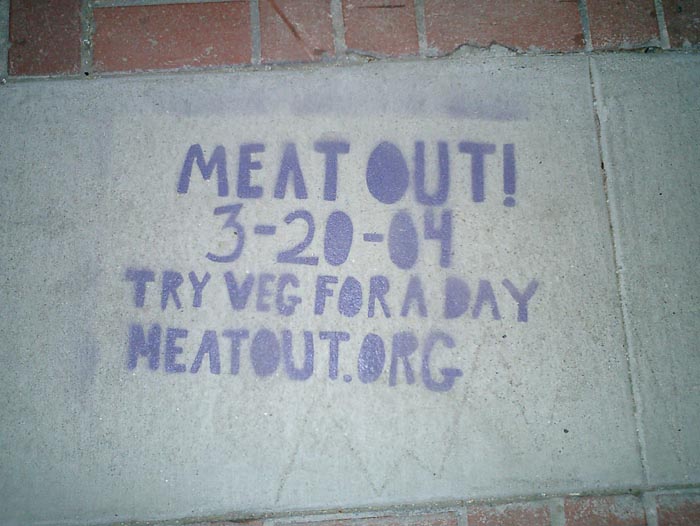
Some political stencil graffiti I spotted this weekend on the sidewalks of San Francisco and Oakland. Click an image below for a larger version.
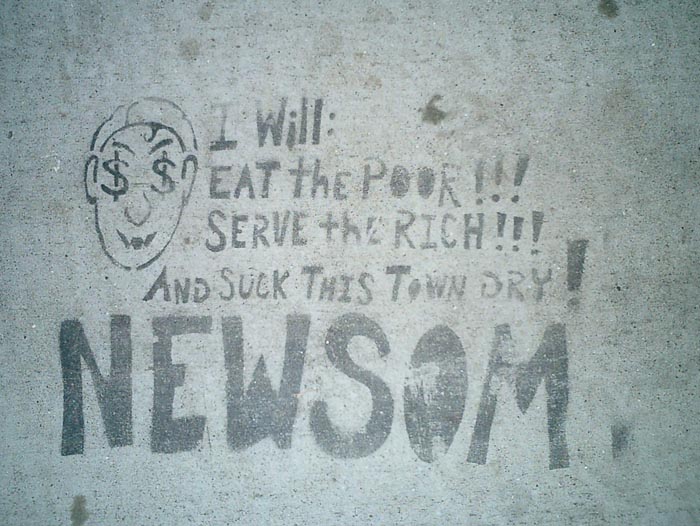
That’s Mayor Gavin Newsom to you.
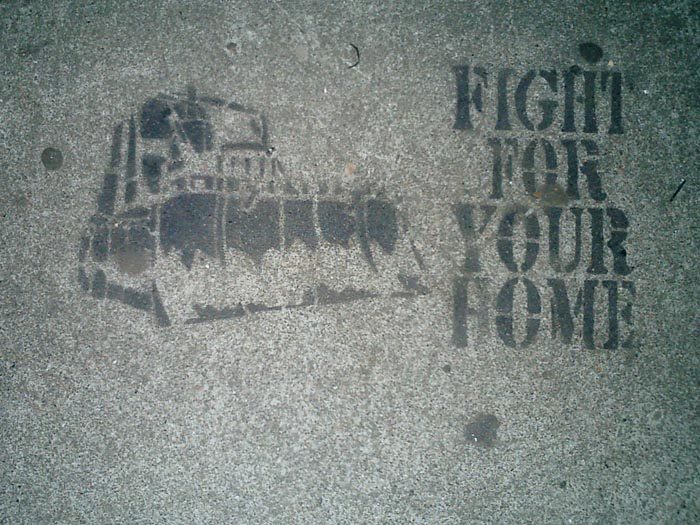
Most buildings built before June 1979 are rent controlled. However, housing prices are so high that some landlords are willing to destroy their buildings to build new ones that can rent at the city’s incredible market price.
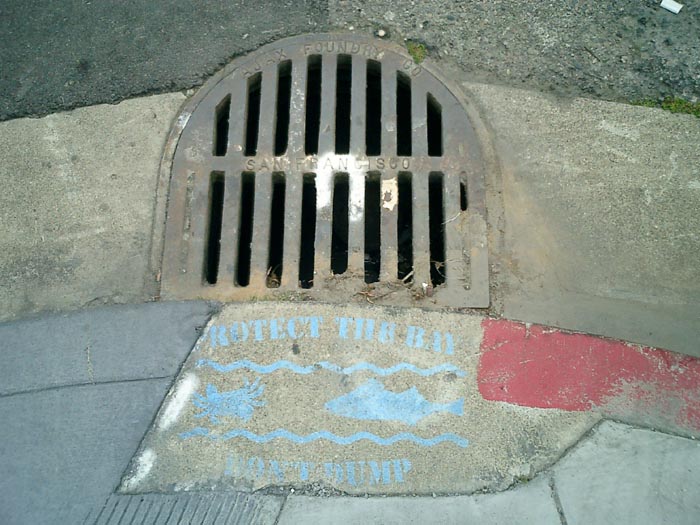
“PROTECT THE BAY / DON’T DUMP”
There’s lots more at http://www.stencilarchive.org/.
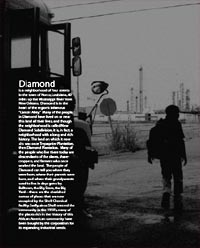
Report Design as an Activist Tool
Good-looking printed documents can complement protests, lobbying, and media work.
This Saturday, Anne Rolfes and Iris Carter Brown from the Louisiana Bucket Brigade spoke about their campaign against Shell to stop polluting their neighborhood.
They talked about a few of the ways reports and Web sites made a difference to people campaigning on the ground.
 Sophisticated graphics convey the impression of an organized, sophisticated movement. One that can overcome its opponents.
- Reports give people pride in their issue, people who have been blown off by governments and powerful corporate opponents. It validates what you think when you see it in print. It makes you ready to take on the man.
- Reports document oral history that may not continue to be passed down. The elders of the community grew up with and around a big old oak tree. Now it’s fenced off, a part of Shell’s industrial property.
- Reports create oral history. Ruth Jones’s son was killed by gas explosion in early 1970s. After the funeral, Shell gave her a check for $500. Ruth agreed to let this be published. The story affirmed the sense of injustice in the community, and the anniversary of his death became an occasion marked by the community annually .
- Reports put the peoples’ side of the story into the mainstream media. Printed reports reach journalists who do not go into the field. The reports tell the details that might not otherwise be told. The documents are also posted on the Web and citations enter electronic press archives. The LABB report began to be cited journals and studies from afar.
- Reports help catalyze the campaign, framing the issues strategically at each phase of the campaign.
- Reports educate different audiences, including elected officials. It makes people in power take the issues seriously. It also encourages people involved in other campaigns, including overseas via the Web site.
- Reports creates room for artistry. Powerful photos and visuals tell the story, and move the emotions.
- Reports create a forum for people in the community. People being poisoned can tell their own stories, put their words into print.
See some of the Louisiana Bucket Brigade’s reports here. They were designed by the Design Action collective and printed by Ink Works Press.
The Bucket
A low-cost, powerful tool for environmental monitoring by communities poisoned by industrial facilities built near their homes.
“The EPA-approved ‘bucket’ is a simple, community friendly tool that fenceline neighbors use to take air samples. Taking air samples is a powerful experience for community members who are used to being ignored, overlooked, and disrespected by corporations and government. Dorothy Jenkins, President of Concerned Citizens of New Sarpy, used to call the refinery to complain about the odors. A low ranking operator would tell her not to worry, that the black plume of smoke that billowed for hours near her home was not harmful. Now Mrs. Jenkins has a bucket. When refinery managers and government regulators tell her that there is nothing to worry about, she answers, ‘Why, then, was there a benzene reading of 14 in my air sample, a reading that violates the state standards?’ The bucket gives community members power to hold institutions accountable to provide a safe and healthy environment.”

From the History of the Louisiana Bucket Brigade:
“The bucket brigades were started in 1995 by attorney Edward Masry (of Erin Brockovich fame) when both were made ill by fumes from a petroleum refinery he was suing on behalf of citizens of Contra Costa County, California. When he called the local, state and federal environmental authorities, they told him that their monitors detected no problem. This so angered Masry, whose clients were being exposed to these toxic releases daily, that he hired an environmental engineer to design a low cost device, the ‘bucket’, which the community could use to monitor their exposure for themselves. This set in motion a movement which would give communities living near refineries, chemical plants or other toxic air emitting sources, a chance to take on indifferent regulators and corporations who were telling them that there is no problem with the air they are breathing while they are choking and dying.
The ‘bucket’ is a low cost $75 version of the $2000 Suma canister used by government and industry and is simple to use. Suspect air is drawn into a Tedlar bag inside the bucket. The bag is then sealed and sent to a laboratory for analysis. The lab analysis is the most expensive part of the operation. For about $500 per sample, the contents of the bag are run through a GCMS (Gas Chromatograph Mass Spectrometer), which compares the ‘fingerprints’ of the sample with the fingerprints of about 100 toxic gases in the computer library. The bag is non-reusable and cost about $15. In practice, much of this cost has been borne by charitable and government grants.
Working closely with Masry, Denny Larson proceeded to promote the use of these buckets in other communities exposed to refinery and other toxic air emissions. Larson hired a student intern to re-engineer the buckets in order to produce a community manual to educate fenceline neighbors that they could build and operate their own air monitoring systems. When completed, the manual helped spread the buckets throughout the refinery belt of Contra Costa County to 7 communities.
The biggest hurdle was getting the authorities, who belittled the idea of citizen bucket brigades, to accept the results. Larson met with EPA Region 9 officials, including the administrator, Felicia Marcus, in 1996 and asked the agency to approve and fund bucket air sampling. To its credit, EPA Region 9 invested in a quality assurance evaluation of the bucket results and ended up accepting them. With the EPA acceptance, Denny was able to work with grass roots groups around the country to launch local bucket brigades.”
Update: Read more about the bucket in this Christian Science Monitor article from April 1, 2004.
Haiti, 1919
 From Noam Chomsky, Year 501: The Tragedy of Haiti, 1993:
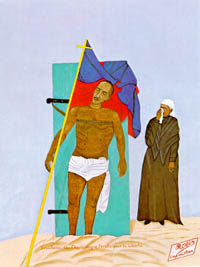
“The leader of the revolt [against the U.S. invasion], Charlemagne Péralte, was killed by Marines who sneaked into his camp at night in disguise. In an attempt at psywar that prefigured some of Colonel Edward Lansdale’s later exploits in the Philippines, the Marines circulated photos of his body in the hope of demoralizing the guerrillas. The tactic backfired, however; the photo resembled Christ on the cross, and became a nationalist symbol. Péralte took his place in the nationalist Pantheon alongside of Toussaint.”
The photograph was immortalized in 1948 by Philome Obin in his painting, Crucifixion de Charlemagne Péralte pour la Liberté.
The World Still Says No to War
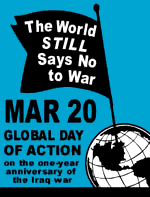 Those little blue stickers are popping on the streets of New York again. This Saturday, on the one-year anniversary of the invasion of Iraq, millions will take to the streets to call for peace. Protests are scheduled in over 50 countries, with over 200 events planned around the United States.
United for Peace and Justice has made variations on their “flag” flyer template available for download with space to add details about your local event or create your own translation, and with rotated globes for events in Africa, Asia, or Europe.
By now there are plenty of downloadable flyers on the Web, but few designed for translation and personalization, while retaining a generally persistent brand. I’ve not seen another organization producing anti-war posters this user-oriented.
Except the Bush-Cheney presidential campaign.
From Wired:
“The Bush-Cheney presidential campaign disabled features of a tool on its website Thursday that pranksters were using to mock the Republican presidential ticket.
The tool originally let users generate a full-size campaign poster in PDF format, customized with a short slogan of their choice. But Bush critics began using the site to place their own snarky political messages above a Bush-Cheney ’04 logo and a disclaimer stating that the poster was paid for by Bush-Cheney ’04, Inc.”
See a handful of sample posters in this nostalgic Fash piece.
GIS and the City
On February 6th, 2004, Al Leidner, former head of New York City’s Department of Information Technology and Telecommunications GIS Program, spoke to members of GISMO about the future of geographic information systems in New York City.
A version of this program was originally presented to the Municipal Data Processing Council. I’ve combined my own notes below with those taken by James Labate.
The GIS Utility: Key Integration of IT
- GIS marries information technology with the science of geography.
- The value of information has become the center point of the industry: the quality, amount, and how integrated it is.
- The technology is there, but the data is lacking. The more combinable data is, the more valuable it becomes. To that effect, the “stove piping” of information is a massive problem.
- From Data to Wisdom: Increasing the value of data should be the goal of the GIS Community.
- The “Where Field” - Geography as an ancient science vs. IT as a new industry. GIS people need to bring geography to IT people.
- We’re still in the early stages of understanding the integration of data. But all data is spatially enabled and therefore can be combined. For example, an automated mapping application can plot a database of 500,000 tree locations off of building and other feature locations.
- Five basic fields on NYCmap, the City government-maintained basemap, are: postal address, latitude and longitude, street segment, parcel, and building. These are all related and identified with a unique ID.
How Do We Create Value?
- With a “critical mass” of data support to NYCmap.
- The Department of Health used a “critical mass” of West Nile identifiers (e.g. infected birds) to created a predictive model of West Nile Disease. (A series of maps were shown depicting the spread of the virus.) Using the maps, they could quickly spray selected areas. Human cases are preempted. Predict death and stop it. GIS can save lives.
- In 9/11, the NYC Office of Emergency Management lost its office and data when the towers collapsed. Responders to the disaster needed combinations of data. GISMO volunteers and others provided data to responders from an ad-hoc office at Pier 92. Speed and ability to deal with complex interactions were key features.
- City’s 311 non-emergency hotline uses a GIS engine which geocodes all data that is taken in. With this, can look for patterns and trends in neighborhoods. (Do trash dumping complaints predict a rise in crime?) The City recently mapped cell phone outages using survey info from 311 and the DoITT Web site.
- My Neighborhood Statistics at nyc.gov, and CMAP’s myCiti expand the knowledge of GIS among non-GIS professionals.
- 40 City, 35 State Agencies create knowledge from GIS data. (See notes on Al’s GIS Coordination Program).
New Developments
- Massive sewer and water system mapping project underway.
- Dept. of City Planning releases geosupport desktop application.
- COGIS - developing better property tax lot outlines.
- Homeland security driving Federal, Local GIS integration.
- FDNY, EMS, NYPD integrating exchange of data for emergency response, sharing with State, FBI.
- Modeling building and subway systems for emergency response. 468 stations in MTA. PATH and Amtrak next.
- Aerial photos, from Pictometry, show all sides of every building in NYC. Free to City agencies.
Opposing the Future - Roadblocks to Progress
- Underfunded IT and GIS.
- Little understanding of the transformative process of IT.
- Contempt for Planning - Outmoded stereotyping.
Cultural Evolution
- What are the combinations of data across service and agency barriers that produce results?
- What are the analytic and predictive tools that can do it?
- Combine all capital projects - see where there are synergies, opportunities to overcome problems.
Benefits
- Revenue: better use of geography will create a higher level of billing accuracy, increasing City revenues.
Public Safety
- Develop an integrated 911. Fire Dept. and Police should be working off the best geocoding system possible to improve response time, plot fastest routes to sites.
- CompSTAT - Police Dept. Application - GIS saving lives. Info and analysis brought together with new way of organizing. (See this BBC article on mapping crime.)
- Hazardous materials and combustibles: combination of previously uncombined data to give firefighters more information before entering a building.
Predictions
- Every City agency will have GIS. Wireless connections to data applications from sites.
- 500% staffing increase in City GIS Personnel.
- Federal Govt. will need and seek out state and local data as it is more accurate and of a higher quality.
- Spatially enabled information will be the foundation of a 35% increase in productivity and 2% increase in revenues.
- All City strategic data will be available and the increase of shared valuable information will increase social cohesion and collaboration.
- Construction time will be reduced 10% and construction costs reduced 5%.
- Predictive models will reduce violent crime by another 50%.
Al noted that more and more City data is available online, though many in audience noted felt that the City does not share enough of its data. NYCMap is not available to the public for “security reasons,” but is licensed to a couple of Universities and corporations under strict terms.
See also “City Governments Map Trends” from Wired, February 1, 2004, and this 2002 interview with Al about GIS and the emergency response on September 11, 2001.
NYC Recycles Glass Again
In case you missed it, yesterday Mayor Bloomberg and the Sanitation Commissioner announced that the City will resume recycling glass and return to weekly recycling collections on April 1.
Glass and plastic recycling was suspended in July 2002 as a “cost-cutting measure.” It turned out that mixing recyclable materials with the regular waste stream did not actually save much money. And, when they found out that others were willing to pay for the City’s recyclables, the City resumed the collections. Bi-weekly plastic recycling resumed July 2003.
See this previous blog post from July 2003.
Huzzah!
Banned in Translation
From Democracy Now!:
“The U.S. Treasury Department’s Office of Foreign Assets Control recently declared that American publishers cannot edit works authored in nations under trade embargoes which include Iran, Iraq, Sudan, Libya and Cuba.
Although publishing the articles is legal, editing is a ‘service’ and the treasury department says it is illegal to perform services for embargoed nations. It can be punishable by fines of up to a half-million dollars or jail terms as long as 10 years.
Robert Bovenschulte, president of the publications division of the American Chemical Society, which decided this week decided to challenge the government and risk criminal prosecution by editing articles submitted from the five embargoed nations.”
From the Treasury Department itself:
“As you know, the importation from any country and the exportation to any country of information and informational materials, whether commercial or otherwise, regardless of format or medium of transmission, are exempt from the Iranian Transactions Regulations, 31 C.F.R. Part 560 (the ITR). ITR, § 560.210(c)....
Nevertheless, certain activities described in your letter would fall outside of the information and informational materials exemption. The collaboration on and editing of manuscripts submitted by persons in Iran, including activities such as the reordering of paragraphs or sentences, correction of syntax, grammar, and replacement of inappropriate words by U.S. persons, prior to publication, may result in a substantively altered or enhanced product, and is therefore prohibited under ITR § 560.204 unless specifically licensed.”
Boy is this ever crying out for civil disobedience from all of us bloggers. I’m not sure if republishing or translating information off the Web is covered by this (since it’s accessible anyway), but posting translations of otherwise published or unpublished material probably would be.
Let the Office of Foreign Assets Control know about it at [email protected]. To complain to the Department of Justice about the issue email [email protected].
Via the Project Censored and Juan Cole
Mapping Feedback
 As far as centrally-coordinated online campaigns go, one technique I’ve particularly admired about MoveOn’s organizing is the way the coordinators gather feedback and circulate it back to the participants of a given action. Participants around the world can read about of what others are doing, and get a sense of the impact and scale of the action. Too many organizations simply fail to ask who is taking offline action. And many send out endless streams of urgent action alerts with little, if any, follow-up.
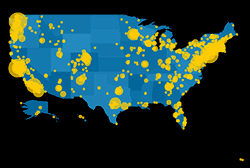
Usually MoveOn’s updates arrive as the text of an email, but this Flash driven map does the job visually and interactively. The map effectively presents both the macro and micro views of the many house parties organized across the U.S. on December 7, 2003 to view the documentary Uncovered: The Whole Truth about the Iraq War.
 Despite the initial written instructions, the interface could be made a little more intuitive by giving shapes of the states some kind of rollover behavior.
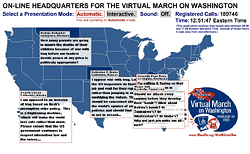
Still, I find it more informative than MoveOn’s previous action map. This map of the February 26, 2003 phone-in rotates the display of only one tesimony per state. Instead of plotting data the map paints a more atmospheric picture of the plurality of voices and the outrage that rained upon the Capitol that day. The geographic shapes only provide a general spatial context to the ticking clock and growing tally of calls.
Between the two is a world map of candle light vigils organized on March 16, 2003. The map displays testimonies, photos, and the sites of vigils, but the user is unable to draw any actual numbers from it, only impressions. The zoom effect is gorgeous, but the testimonies quickly overwhelm, like hundreds of little pop-up windows you’re unable to move or close.
The maps were all designed and programmed by Stamen Design in San Francisco.
...
See also this Jully 2004 item about Stamen Design’s live, interactive conference call map.