

org
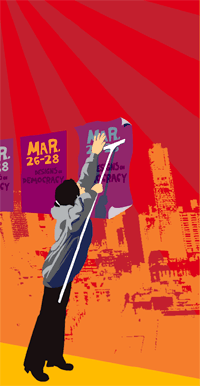
Impressions of Designs on Democracy
From March 26-28, I attended the Designs on Democracy conference on the UC Berekely Campus. I’ve been meaning to write up my impressions but have found it difficult to put words to those three incredible, densely-packed days of presentations, meetings, networking, and solidarity. Where to begin?
From the Bay Area Indymedia center:
“Designs on Democracy was a three day conference on design, advertising, public relations and marketing for social change.... The conference was organized by a crew of eight activists. Forty volunteers did the work that made it happen for the 350 who attended. Designs on Democracy, said Favianna Rodriguez, one of the organizers: ‘is not just for designers, it’s for people who are in the business of doing marketing and selling the image of the Left, to take it to a broader audience and make it more appealing.’”
 They’ve already posted two pages of notes and several audio files of the conference sessions in Ogg Vorbis format. More audio, video, and documentation is on the way.
The organizers from Tumi’s Design, the Ruckus Society, the Design Action collective, and Change the Game did an amazing job, clocking in months of preparation. The speakers, attendees, and volunteer tech crew were also incredibly flexible and generous.
The sumptuous, donated food also merits special mention, particularly from the Sankofa Kitchen Project, a black, vegan cooking collective in Oakland. The project is part of the East Side Arts Alliance and works with youth to build community gardens, teaches them how to grow and cook their own food, and promotes traditional cuisine, community spirit, and good nutrition — in part a response to the cheap, corporate, fast food crap showered on poor, urban neighborhoods.
Participants arrived from a range of organizations and backgrounds. Some were designers, organizers, techies, printers, media workers. Some from unions, others working on prisons, environmental justice, or genetically modified foods. Some worked in advertising, others on access, training, media justice, or getting out the vote. Some were just designers looking for a way to do more.
Some were veterans, active since the 1960’s, others just fresh out of school. Some owned their own businesses, some worked in collectives or in non-profits, and still others were freelance.
And, where other events of its kind might have fractured into quarrelling ideological factions, here there was common cause: Bush must go.
Many of the conference sessions focused on messaging, narrative, and framing to communicate effectively, move “the middle,” and build a stronger movement for social justice. The list of sessions and speakers makes for interesting reading.
I gravitated towards the more practical sessions, on fund raising and organizational structures. I won’t go into detail about individual sessions — will post more of my notes here soon — but here are a few other impressions and tidbits:
- Several speakers addressed the importance of focus groups and research, and within that the notion of using different messages for different cultural groups. An easy way to recruit for focus groups is to advertise on craigslist. (Offering pizza helps.)
- Favianna and the staff of Tumi’s see themselves within a tradition of radical graphic work in the Americas and on the West Coast: Siquieros, Rivera and the muralists of the Mexican revolution, artists and writers in Chile who created culture of resistance, the independent publishing of the Black Panther Party, the Chicano movement of the 70’s and their work with the United Farmworkers. Like the Young Lords, the Native American Movement, and the BPP, Tumi’s program is to serve the people. “Without the movement, without the grass roots, graphics work is not revolutionary.”
- Only one member of Congress has a child serving in the war.
- In the U.S., you can buy voter registration lists. It’s not cheap, but it is public information. You can cross reference the data with your membership list or demographic information to more effectively market to voters.
- If you’re an unaffiliated designer with a project idea and you want to raise funds, consider finding a non-profit organization willing to act as a fiscal sponsor. You can arrange for tax-deductible donations or foundation support through them, in exchange for a small percentage of the proceeds.
One topic of discussion that was missing from the conference was information design and mapping. This is not just marketing, but using design for analysis and making data accessible. See, for instance, the 2000 Palm Beach County ballot design.
In addition to meeting many new people, I had the chance to meet several people I’d previously known only online including Jason Justice, founder of the Graphic Alliance, an electronic network of progressive designers, and Alex Steffen of the community Web log worldchanging.com. It was also great to reconnect with a couple of folks I’d met at the Ruckus Tech Tools Action Camp in 2002.
Overall, the air crackled with excitement and energy. It was nice to recharge, to find out everyone was doing, and to find among them a progressive community of designers. Many, including myself, didn’t want this to end with the conference itself.
So what’s next? Another one in a couple of years? Perhaps local or regional conferences? An international federation of progressive designers? For now, a database of resources is in the works and will eventually be posted on the site. Watch this space for more.
Report Design as an Activist Tool
Good-looking printed documents can complement protests, lobbying, and media work.
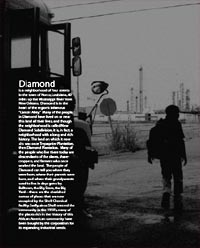
This Saturday, Anne Rolfes and Iris Carter Brown from the Louisiana Bucket Brigade spoke about their campaign against Shell to stop polluting their neighborhood.
They talked about a few of the ways reports and Web sites made a difference to people campaigning on the ground.
 Sophisticated graphics convey the impression of an organized, sophisticated movement. One that can overcome its opponents.
- Reports give people pride in their issue, people who have been blown off by governments and powerful corporate opponents. It validates what you think when you see it in print. It makes you ready to take on the man.
- Reports document oral history that may not continue to be passed down. The elders of the community grew up with and around a big old oak tree. Now it’s fenced off, a part of Shell’s industrial property.
- Reports create oral history. Ruth Jones’s son was killed by gas explosion in early 1970s. After the funeral, Shell gave her a check for $500. Ruth agreed to let this be published. The story affirmed the sense of injustice in the community, and the anniversary of his death became an occasion marked by the community annually .
- Reports put the peoples’ side of the story into the mainstream media. Printed reports reach journalists who do not go into the field. The reports tell the details that might not otherwise be told. The documents are also posted on the Web and citations enter electronic press archives. The LABB report began to be cited journals and studies from afar.
- Reports help catalyze the campaign, framing the issues strategically at each phase of the campaign.
- Reports educate different audiences, including elected officials. It makes people in power take the issues seriously. It also encourages people involved in other campaigns, including overseas via the Web site.
- Reports creates room for artistry. Powerful photos and visuals tell the story, and move the emotions.
- Reports create a forum for people in the community. People being poisoned can tell their own stories, put their words into print.
See some of the Louisiana Bucket Brigade’s reports here. They were designed by the Design Action collective and printed by Ink Works Press.
The World Still Says No to War
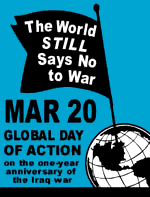 Those little blue stickers are popping on the streets of New York again. This Saturday, on the one-year anniversary of the invasion of Iraq, millions will take to the streets to call for peace. Protests are scheduled in over 50 countries, with over 200 events planned around the United States.
United for Peace and Justice has made variations on their “flag” flyer template available for download with space to add details about your local event or create your own translation, and with rotated globes for events in Africa, Asia, or Europe.
By now there are plenty of downloadable flyers on the Web, but few designed for translation and personalization, while retaining a generally persistent brand. I’ve not seen another organization producing anti-war posters this user-oriented.
Except the Bush-Cheney presidential campaign.
From Wired:
“The Bush-Cheney presidential campaign disabled features of a tool on its website Thursday that pranksters were using to mock the Republican presidential ticket.
The tool originally let users generate a full-size campaign poster in PDF format, customized with a short slogan of their choice. But Bush critics began using the site to place their own snarky political messages above a Bush-Cheney ’04 logo and a disclaimer stating that the poster was paid for by Bush-Cheney ’04, Inc.”
See a handful of sample posters in this nostalgic Fash piece.
Mapping Feedback
 As far as centrally-coordinated online campaigns go, one technique I’ve particularly admired about MoveOn’s organizing is the way the coordinators gather feedback and circulate it back to the participants of a given action. Participants around the world can read about of what others are doing, and get a sense of the impact and scale of the action. Too many organizations simply fail to ask who is taking offline action. And many send out endless streams of urgent action alerts with little, if any, follow-up.
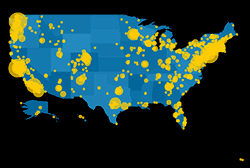
Usually MoveOn’s updates arrive as the text of an email, but this Flash driven map does the job visually and interactively. The map effectively presents both the macro and micro views of the many house parties organized across the U.S. on December 7, 2003 to view the documentary Uncovered: The Whole Truth about the Iraq War.
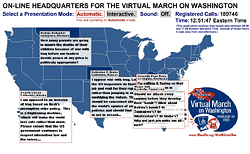 Despite the initial written instructions, the interface could be made a little more intuitive by giving shapes of the states some kind of rollover behavior.
Still, I find it more informative than MoveOn’s previous action map. This map of the February 26, 2003 phone-in rotates the display of only one tesimony per state. Instead of plotting data the map paints a more atmospheric picture of the plurality of voices and the outrage that rained upon the Capitol that day. The geographic shapes only provide a general spatial context to the ticking clock and growing tally of calls.
Between the two is a world map of candle light vigils organized on March 16, 2003. The map displays testimonies, photos, and the sites of vigils, but the user is unable to draw any actual numbers from it, only impressions. The zoom effect is gorgeous, but the testimonies quickly overwhelm, like hundreds of little pop-up windows you’re unable to move or close.
The maps were all designed and programmed by Stamen Design in San Francisco.
...
See also this Jully 2004 item about Stamen Design’s live, interactive conference call map.
Popular Delusions and The Madness of Cows
Since we know exactly how mad cow disease is spread, it should be pretty easy to identify which meat to buy just by finding out how the cows are raised. Free range? Grass fed? Organic? It’s all labeled there on the package, right?
You might be surprised to find out just what falls into the gap between “Grass Fed” and “100% Grass Fed.”
 In steps the Consumers Union to provide the story behind the cypher:
“Consumers Union (CU), the independent nonprofit publisher of Consumer Reports magazine, is providing consumers with important information about which meat labels can and cannot help consumers wanting to reduce their the risk from mad cow disease.
Mad cow disease is known to pass from one animal to another through the use of animal by-products in animal feed. Certain labels indicate that animal by-products are not used in the feed that produced the meat. Therefore, meat carrying these labels is very low risk in terms of mad cow disease.
The information is posted at eco-labels.org which lists the the most helpful labels (“Organic” and “Biodynamic”) somewhat helpful labels (like “100% Grass Fed”), and labels that should not be relied upon to reduce the risk of exposure to mad cow disease (like “Free Range”).
In addition to meat labes, the site lists terms and labels from other food, household, and personal care products, and clearly states which terms do or do not have official definitions and organizations who verify compliance.
From eco-labels.org:
“CU launched www.eco-labels.org in the spring of 2001 to help educate consumers about these labels. Consumers Union believes that the best eco-labels are seals or logos indicating that an independent organization has verified that a product meets a set of meaningful and consistent standards for environmental protection and/or social justice....
The purpose of this site is to provide information to consumers regarding eco-labels, products that carry eco-labels, the organizations that produce eco-labels, and government and private standards for ‘green’ products. Our goal is to help consumers make more informed choices in the marketplace, and participate more effectively as citizens in important decisions that affect the environment.”
Designs on Democracy: Communication for Liberation
The Design Action Collective, the Ruckus Society, and Change the Game are holding a conference on design for social justice.
Designs on Democracy: Communication for Liberation is billed as:
“a forum for networking and dialogue on the strategic role of graphic communications, public relations and guerilla marketing in the service of organizing for Justice.
The Designs on Democracy conference is for activists working in graphic design, communications, public relations, Web and new media, issue advertising, guerilla messaging, and emerging and student activists in these fields.
Through three days of speakers, workshops, panels and networking, participants will:
- Strategize about the role of activist design and communications in supporting critical struggles in the coming years.
- Build and strengthen long-term working relationships between individuals and firms specializing in activist design and communications across the United States.
- Share skills and experience to improve the services available to movement organizations.
- Create a forum where emerging designers with activist interests can connect with established firms for career, intern and volunteer opportunities.
- Provide an opportunity for campaigners and organizers to connect with design and communication activists.”
The conference will be held from March 26-28, 2004 at the University of California, Berkeley. Contact the organizers for more info.
The provisional agenda seems to focus heavily on marketing, but the organizers are open to suggestions. I’d recommend a session on design that facilitates organizing and public pariticipation. Perhaps one on information design and mapping for advocacy.
I attended the Tech Toolbox Action Camp that the Ruckus Society threw back in June 2002 and certainly got a lot out of it. I might just try to make it to this one, too.
Designing Supportive Housing, 2
I’ve been taking a break from blogging to wrap up a few projects, but here’s a quick follow-up to a previous item from June on supportive housing:
 “Common Ground Community and The Architectural League of New York’s First Step Housing design competition ended this week with five entries sharing top honors.
Competitors were asked to design a prototypical individualized dwelling unit and the layout of 19 such units on a typical floor of The Andrews � Common Ground’s lodging house on the Bowery - which will shortly be renovated to house the First Step Housing Program. First Step will offer private, safe, clean and affordable short-term accommodations to individuals who are transitioning to housing, facing homelessness, or who have rejected or failed in other programs.”
Art, Organizing, and Memory
Ricardo Levins Morales, from an abstract of Art, Organizing, and Memory:
“The telling of history is more than an exercise in documentation. It has always been an important element in shaping history. Historical narrative provides important information about both specific tactics and strategies and broader possibilities for action. Consequently, the struggle to control the memory of events is an important element of social conflict.
 The Northland Poster Collective participates in this aspect of social (particularly workplace) struggles on three levels. Working with organizers and rank and filers we help them to identify and redefine the workplace narrative. To effectively organize, it makes a difference whether workers see themselves as part of a big, happy family; as engaged in a David vs. Goliath struggle; as rugged individuals who must each make their own way; as a community of interest in an exploitative environment, etc. Art, humor, and creative tactics can create a receptive atmosphere organizing and leadership development.
Telling untold (or miss-told) stories that can suggest avenues for action. Even when figures or events from social struggles are integrated into mainstream teaching they are presented in ways that emphasize individual heroics and chance. Our classroom posters focus on the collective action, planning, and community connection that offer a more reliable roadmap for creating change. By our choices of what stories to depict we help to challenge widely held notions about who is an actor in history.
Posterfolio sets help to bring more depth of knowledge (and curiosity) about events that people may know of only superficially. Posters that challenge deeply held assumptions. Less immediate in their impact, these may illustrate word definitions or the histories of everyday items, foods, etc. Seemingly innocuous, these posters contain layers of social history and suggest connections to other peoples that are absent from mainstream and commercial culture.
Making use of history as a lever for real change requires strategies for its dissemination. Our approach has been to use our relationships with schoolteachers, unions, and community organizations to distribute the work that we produce. These networks are also the source for information on the needs of the people at the front. Organizing seeds have a hard time growing in hostile soil. Tending to the cultural soil of the workplace, community, and broader society is a long-term and essential element in any strategy for change.”
The Violence of Planning (and Its Resistance)
From Adrian Blackwell and Kanishka Goonewardena, Poverty of Planning: Tent City, City Hall and Toronto’s New Official Plan, in Planners Network, Winter 2003:
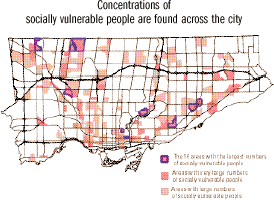 “While the [new official plan of the city of Toronto] represents a victory for the ruling classes of Toronto... some of the background documents prepared for the plan reveal traces of a struggle, even within City Hall. Toronto at the Crossroads, for example, includes a crystal clear map of the concentrations of ‘socially vulnerable areas’ in the city. It illustrates the growing economic polarization and pockets of poverty that form a ring running through the outer suburbs and around the inner city. Any reasonable official plan aiming to build a sustainable and equitable urban life would have started with these realities — the majority of existing people in the city — rather than banking on an exodus of dot.com millionaires and other pipe dreams of the ‘knowledge economy.’
The urgent question is this: What will happen to the various socially vulnerable groups in the city whose neighborhoods are either ignored in this plan or earmarked for gentrification?
The plan actually paves the way to remove people from strategic downtown neighborhoods, concentrating poverty in high-density suburban spaces whose reality is deliberately hidden in its three-lens vision. Complementing this violence of eviction is the alienating physical and symbolic violence constantly inflicted on individuals forced to live in these suburban spaces. These have a number of real effects.
- The physical distance between social classes protects affluent people from the violent power and frustration that economic exploitation creates.
- The physical separation prevents middle- and upper-class Torontonians from experiencing poverty firsthand, allowing them to indulge a fantasy of equality, while breeding stereotypes about people they don’t have to interact with everyday.
- Separation organizes the city so that affluent people have much better access to not only luxury goods, but also to essential services like healthy food, a clean environment, healthcare, public transportation, parks, public spaces and jobs.
- Isolation atomizes the very communities that could otherwise create unified resistance to this alienating condition. One of the lasting legacies of Toronto’s high-density modernist housing is that people are both concentrated and isolated from one another at the same time.
Real separation and isolation are symbolically overcome in the image of the beautiful city. The objective of urban design here is to mask beneath the spectacle of dazzling urban space the potentially explosive realities of the new amalgamated city of developers, taxpayers and global capital.”
The authors are members of Planning Action:
“A group of urban planners, architects and activists who work with diverse communities of Toronto struggling against economic, cultural, and ecological injustice to open spaces for people to imagine, transform, and enjoy the city.”
Their objectives:
- To collaboratively promote social and environmental justice by planning for affordable housing, food, public transportation, public space and accessible education and recreation for all residents and workers of the city.
- To democratize planning practice to foster greater participation and control over the creation and maintenance of the city.
- To build an organization that is committed to radically democratic and socially just practices within its own operation, in its partnerships and collaborations, as well as in the city.
Their work includes:
- popular education and outreach;
- planning, design, and advocacy for individuals and communities marginalized from traditional planning and legal systems;
- promotion of participatory planning that creates alternatives to municipal, competitive, and corporate-driven planning practices; and
- public comment and criticism of development projects, international trade agreements, and city practices, plans, policy, and processes.
First Nations, Mapping
In an article for Wired News on activists using of video and imaging, Julia Scheeres notes:
“Around the globe, indigenous tribes are mapping their ancestral land boundaries using global satellite positioning systems to guard against depredations by local governments and private companies.”
The article points to the Aboriginal Mapping Network:
 “A collection of resource pages for First Nation mappers who are looking for answers to common questions regarding mapping, information management and GIS. It is a network where First Nation mappers can learn about what other native mappers are doing, and share their own experiences throughout the aboriginal community. The AMN has a British Columbia focus, but is not limited to this geographic region. It is intended to be used by any group who is active in aboriginal mapping, from the introductory level, to the advanced. It is a source for both technical information on GIS mapping, to general information relevant to decision makers.”
The main areas of activity are:
- The Web site and electronic newsletter with information on data sources, training resources, funding, and news.
- Publication of resources and “best practices.”
- Informal roundtable workshops and the annual international GIS conference where First Nations organize and present mapping issues on First Nations terms.
The site’s extensive gallery hosts maps illustrating traditional territories, current boundaries, boundary disputes, traditional place names, environmental classifications, and cultural and ethnographic data — including some from pre-contact eras. Some good links, too, pointing to other sites with maps and mapping resources by and for Aboriginal peoples.
In June, the International Forum on Globalization’s Indigenous Peoples and Globalization program published a map depicting the negative impacts of economic globalization on indigenous peoples.
For another overview of the AMN, see Benjamin David Johnson’s 1999 thesis, The Aboriginal Mapping Network: A Case Study In The Democratization of Mapping:
“Critical mapping theory suggests that maps are subjective documents that implicitly but powerfully articulate the agenda of the culture that created them... Further, the interests portrayed on conventional maps are almost exclusively those of the dominant groups in society. It will be argued in this thesis that the Aboriginal Mapping Network provides a means to develop mapping skills in First Nations communities, therefore leading to the creation of maps that convey alternative visions of reality. These maps can be used in the planning process to counterbalance what John Forester (1989) would suggest is the ‘misinformation’ inherent in conventional maps....
Capacity building in GIS technology, it is argued, will allow First Nations to produce unconventional maps that articulate local worldviews and perceptions of place. As embodiments of local knowledge, these maps will in turn be used in planning, negotiations and governance to empower First Nations on their own terms.”